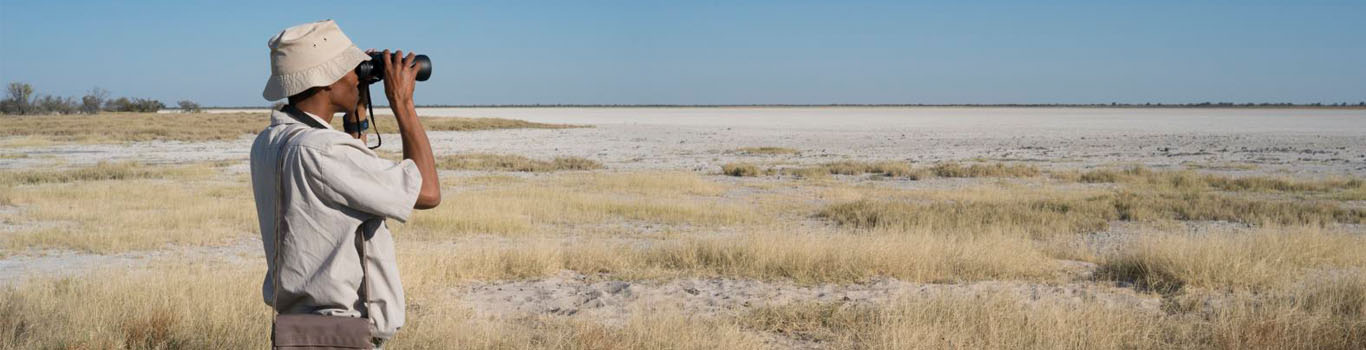


Different areas, different conditions

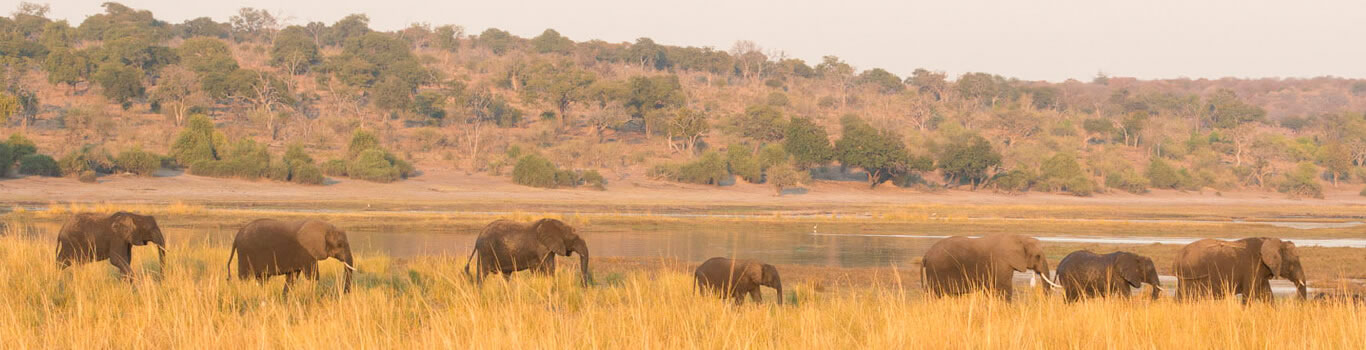
In the communal areas of some regions, the entire population lives in conservancies, which show great variations in size, population density and land-use activities. The diversity and abundance of game and other natural resources differs significantly, influenced by differences in climate, topography, soils and water availability.

The relationship of conservancies to urban areas and infrastructure development also varies. In the north-central regions, more than 40,000 people live in conservancies, although this represents only around 5% of people in the densely populated area, many of whom live in urban centres. Other regions have only small communal areas, or none at all. These factors make some communal areas more suitable to conservancy formation and CBNRM activities than others.
| Region | Area covered by conservancies (km2) | Percentage of communal land covered by conservancies | Number of people living in conservancies | Percentage of communal area residents in conservancies |
|---|---|---|---|---|
| Erongo | 17,289 | 91.5 | 7,594 | 55.8 |
| Hardap | 1,424 | 18.4 | 838 | 10.5 |
| Karas | 6,550 | 41.7 | 4,636 | 32.8 |
| Kavango (E&W) | 3,582 | 8.8 | 22,027 | 15.6 |
| Kunene | 60,702 | 81.9 | 75,124 | 76.2 |
| Omaheke | 18,404 | 42.5 | 7,000 | 21.9 |
| Omusati, Ohangwena, Oshana, Oshikoto | 13,095 | 24.7 | 53,589 | 5.2 |
| Otjozondjupa | 41,059 | 100.0 | 39,981 | 100 |
| Zambezi | 4,092 | 39.4 | 33,798 | 33.9 |
| Khomas | no conservancies | no communal areas | no conservancies | no communal areas |
| Total | 166,179 | 54 | 244,587 | 15.45 |
A national population census is usually conducted every 10 years in Namibia. The last census was in September 2023 (results are currently being compiled) and, prior to that, in 2011. The figures in the table represent an estimate for 2022.